Understanding the Product Details Stats Report in Presatshop 1.5
The product details report allows you to view the statistics regarding how often a product is viewed versus how often it is purchased. The following article explains the report and how to use it to help your Prestashop 1.5 shop.
Viewing the Product Details Statistics Report in PrestaShop 1.5
- Log in to the PrestaShop Admin Dashboard as an Administrator
- Hover over the end of the menu bar to the right where it is labeled "STATS". Click on STATS when it appears in the drop-down menu.
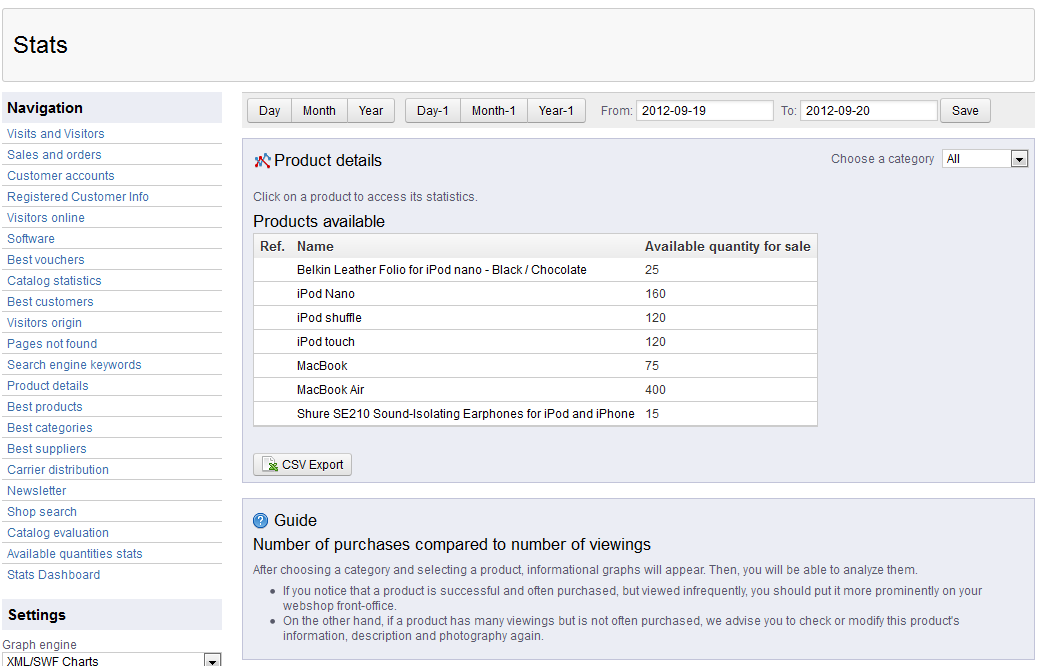
- When you get to the main STATS DASHBOARD, go to the left-hand column labeled NAVIGATION, then click on PRODUCT DETAILS. You will see a report similar to the one below:

There are 3 main functions available with this report
Time-based Stats Filtering
As with all the reports, there is the filter bar at the top that allows you to explore the data based on time ranges. To select a date range, click in the FROM field to enter the start date and then click on TO field in order to see the end date. Then Click SAVE in order to save your entries.
Category Filtering
Under the FILTERS and to the right of the report title is a drop-down menu that is labeled "CHOOSE A CATEGORY." By default, it is labeled ALL. This drop down menu lets you isolate the data presented in the report. Click on the drop-down menu and select a specific category if you wish to filter the report results with this option.
CSV Export
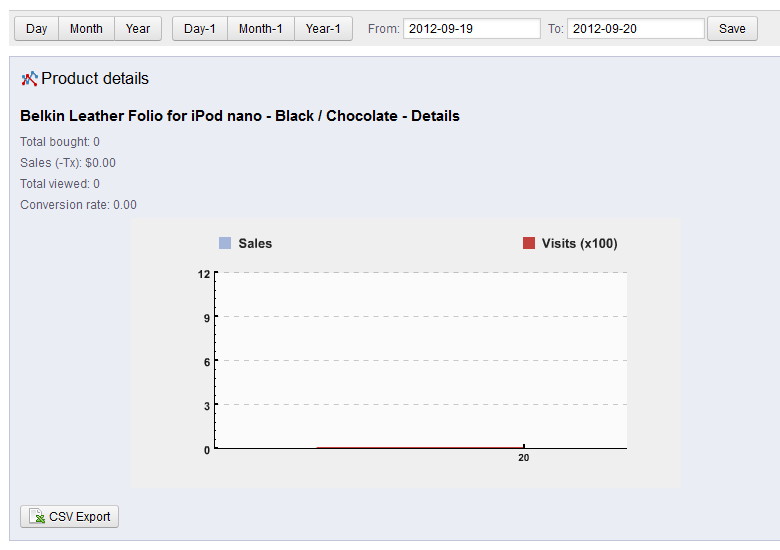
Under the report results is a common option for exporting the data to a comma-separated-value report. This allows you to be able to share the data with other applications. Click on the CSV EXPORT button in order to export the data. - Click on one of the results in the report and you will see that you can drill down into the report for a further analysis of the data using a line graph. Here's an example of how the graph may appear as below:

The GUIDE section below the graph gives you great advise on how to use the results of this report.
The PRODUCT DETAILS report is used to determine how your products are selling versus the number of times the product is viewed. If you're seeing that the item is viewed often and the corresponding sales are also up, then you may not have to change anything, or you might want to consider a sale to further increase the success of a particular item. On the other hand, if your report shows something being viewed infrequently and with a corresponding number of sales, then you might want consider changing the description and media (e.g. pictures, video, etc.) to help with change this trend.

We value your feedback!
There is a step or detail missing from the instructions.
The information is incorrect or out-of-date.
It does not resolve the question/problem I have.
new! - Enter your name and email address above and we will post your feedback in the comments on this page!